
Smooth bonus portfolios are a key investment tool for pension fund members in South Africa. Insurers design them to balance growth potential with downside protection. These portfolios smooths returns over time, reducing the impact of market volatility while offering different levels of capital protection. While the focus is usually on their benefits in a pre-retirement scenario, this article evaluates their benefits in a post-retirement (living annuity) scenario.
Overview
A partially vesting smooth bonus portfolio (incorporating simplified management rules and capital charges) is compared to a growth-oriented market-linked portfolio, where both portfolios have the same underlying asset allocation of 60% equities, 20% bonds, 10% property, and 10% cash. The simulation study used 1 000 randomised scenarios (including returns and inflation) to assess the portfolios’ performance over a 30-year retirement period. The primary performance metric was Time to Ruin (TTR), which measures how long an annuitant’s capital can sustain inflation-adjusted monthly drawdowns. Drawdown rates start at 4%, 6%, or 8% per annum and are adjusted annually.
The following risk measures were used to analyse the differences in investment outcomes for retirees:
- Mean TTR: This measures the average TTR across all 1 000 simulated scenarios, indicating how long capital is expected to last for on average.
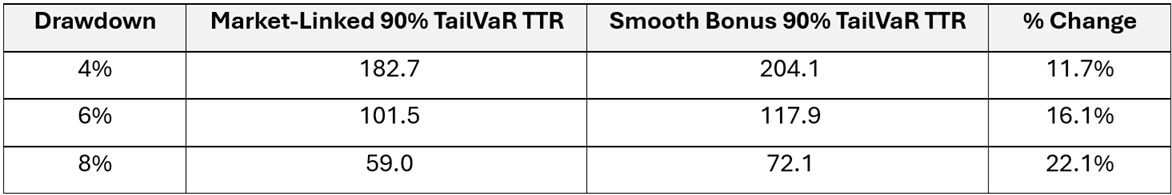
- 90% TailVaR TTR: The tail value at risk (TailVaR) at the 90th percentile measures the average time to ruin for the worst 10% of scenarios. It shows how long capital is expected to last during extreme conditions, such as extended market downturns or unfavourable sequences of returns, and highlights portfolio performance under financial stress.
Key Findings from the Modelling Exercise:
1. Market-linked portfolios last longer in general
When averaging across all investment scenarios, the market-linked portfolio has a longer TTR than the smooth bonus portfolio. This is expected, given the higher cost structure of smooth bonus products (due to the guarantee) and the lagging effect of its smoothing mechanism.
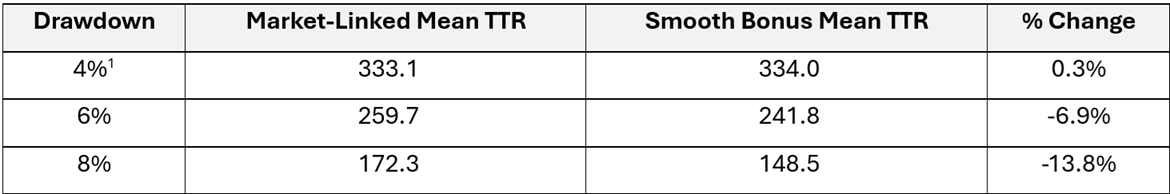 [1] The modelling time horison is limited to 360 months, which affects the results at a 4% drawdown the most. Therefore, caution should be used when interpreting these mean TTRs.
2. Smoothed bonus portfolio excels during tail scenarios.
In the worst 10% of scenarios, where market downturns or sequence of returns risk typically occur, smooth bonus portfolios provided significantly better TTR outcomes for retirees. By smoothing returns and protecting capital, these portfolios provide increased protection for annuitants against the loss of income due to capital erosion, providing retirees with stability in stressful times.
Summary
Market-linked portfolios are expected to perform better on average, but the benefits of smooth bonus portfolios become clear when evaluating their performance in the adverse market conditions, such as those observed in the worst 10% of scenarios. The most recent example of an adverse market scenario would be the Covid-19 market crash where the JSE ALSI declined by more than 30% during the first quarter of 2020. Here many retirees who were fully invested in market-linked portfolios saw sharp declines in their capital, forcing tough financial decisions, such as whether to de-risk. In contrast, retirees who were invested in smooth bonus portfolios experienced stability in their fund value, with their capital protected from the sharp market declines.
Given this, retirees may want to consider structuring their living annuities to balance growth and protection by using smooth bonus portfolios. One potential “best of both worlds” strategy, which will be explored in a future article, is to allocate a portion of their living annuity - enough to cover essential living expenses - to a smooth bonus portfolio, while keeping the rest in a market-linked portfolio for long-term growth.
Disclaimer: This blog is for general information and education only. It does not constitute advice (financial or otherwise) and should not be relied upon as such. I am not licensed to provide financial advice. The content may contain errors or omissions and is provided without any guarantee of accuracy or completeness. No liability is accepted for any loss or damage arising from reliance on this content. For advice tailored to your circumstances, please consult a registered financial advisor.